
Next time you have to create a timeline in PowerPoint, why don’t you make it an animated one? One that grabs your audience’s attention.
Start with some custom shapes that you Merge with Union into a new freeform shape. Now, place this new freeform shape on top of your main image. – any shape will do, it could even be a photograph in the form of a .jpg image. The idea is to create a cut-out of the picture or shape to tell your story with.
Using Merge Shape in PowerPoint.
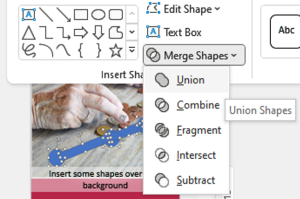
It is possible to merge several shapes with the Merge Shape function in PowerPoint. The merging of shapes can happen in a variety of ways. The more interesting ones are described below, but you should experiment with the others!
Union.
The Union function turns two or more shapes into one new Freeform shape. In the example below, a square and a circle are “united” to create a new shape. This shape is not a standard PowerPoint shape. But if you needed a circle with pointy bits, you now have one. The order in which the shapes are selected does not matter. Think of the Union function as an addition in arithmetic.


Combine.
The combined function is like subtraction in arithmetic. With this function, one shape is removed from another. In the example below, a square shape is removed from a round shape. Unlike subtraction in arithmetic, it does not matter which shape is selected first or which shape is in front – although these choices will influence the color. (In the Subtract function, it does matter.) The Combine function is therefore a quick way of subtracting one shape from another. If you find that the color of your resulting object or picture is not what you had in mind, try selecting the object whose color you wanted to preserve first.
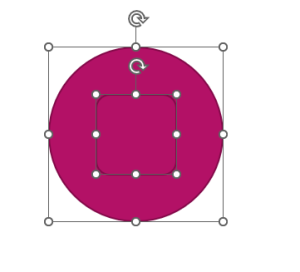

A square and a round shape merged with the combined function
For an animated timeline, I Union-ed several thin rectangles and circles to depict the lines of a graph. I planned to Combine this new shape with a picture that would tell my story. The combined effect would be a void in the picture. An animated object will then move behind the picture and be visible through the void.


Continuing the theme of retirement savings, I have now “cut-out the” the savings graph from an image. (Note that if you save the image at this point as an SVG (scalable vector graphic) file, you will preserve the cut-out effect in your saved picture for later use. That is not the case if you save it as a JPG image.) The bottom picture is in the original JPG format. I created the “cut-out” with the combine function, to remove the freeform shape of the graph from the picture

Animating the object behind your picture that tells your story in PowerPoint.
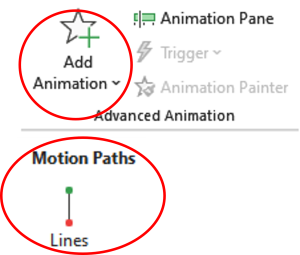
There are four “stops” in this simple graph. (There could off-course be many more.) The animated object should appear at the first stop, move to the second stop, and so forth. To achieve this effect one has to have several line path animations moving the object. When inserting a line path animation, look for the red dot and the green dot on your object.

The green dot represents where the object will move from. And the red dot where it will move to. Both dots can be dragged, yielding ghost objects when you start dragging.

So, the following series of steps should be followed to get your “pointer” behind your picture to move correctly.
1. Create a circle shape. It can be anywhere on your slide. (Because you have the green dot to play around with. You can even draw it off your slide.)
2. Insert Line path animation.
3. Move the red dot to the first stop of the graph.
4. Click on Add Animations and select Line Motion Path animation again.
5. Move the green dot now to the red arrowhead (i.e. endpoint) of your first Line path. Move the red dot to the second stop of the graph. So, the object will now move to the first stop and then appear to move to the second stop, and so forth.

7. Repeat until you have covered all the stops.

8. Move your shape to be animated below your cut-out to simulate a progression over time.
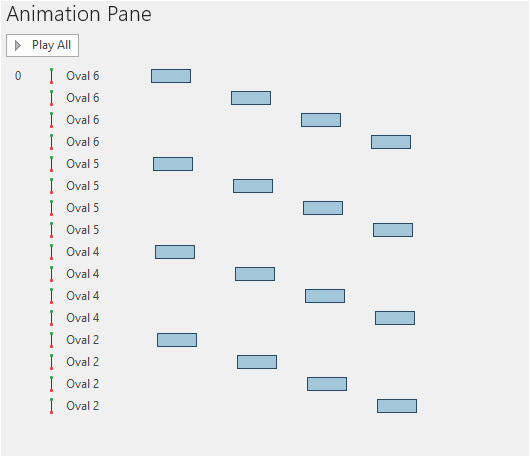
Final PowerPoint Animation

The “stretchy” effect of the pointer was obtained by making three additional copies of the pointer and delaying some of their start times by 1/10th of a second. Your animation pane should therefore look as follows:
Please let me know what you think. Please also look at this Interactive animated timeline
If you would like me to e-mail this PowerPoint presentation and other information on this topic to you, please share your contact details below: